Customer churn
A model that flags which customers are about to leave, and what is pushing them.
Data and BI · Python · Browsable demo
The problem
Acquiring costs far more than keeping, so the profitable question is not how many left last month but who leaves next month. A post-mortem count leaves no room to act; a probability per customer does.
What it does
- Builds a labelled dataset and prepares it: one-hot encoding, feature selection and normalisation.
- Corrects class imbalance with balanced weights and a stratified split, so the churning minority is not drowned out.
- Trains a logistic regression, chosen over more opaque models because its coefficients read directly as business drivers.
- Publishes a dashboard with churn probability per customer and the factors behind it.
What was decided while building it
- Logistic regression, and the reason is stated
- It was chosen for interpretability: every coefficient reads as a business lever. An ensemble would probably rank slightly better and would say nothing a board could act on. The decision is stated in the repository; what does not exist is a comparison against the model that was set aside.
- Balanced weights: better to over-flag
- The threshold is pushed towards catching whoever is leaving, even though that fills the list with false alarms. Four out of every five flagged were not going to leave. The trade-off is deliberate and only pays off if a retention call costs a good deal less than losing the customer, and this repository does not model that cost.
- The metrics are written by the code
- The results write-up used to be maintained by hand and drifted away from the code: it ended up publishing an accuracy from a dataset that no longer existed, and no AUC at all. The script now emits it alongside the dashboard JSON. A number nobody can regenerate is a number nobody should publish.
- Bands are ordered by value, not alphabetically
- The amount bands are ordered categories, so one hundred to one hundred and twenty does not sort before forty to sixty. And the four segment files share a single shape: emitting a different key in each one is what left three of the four charts without axis labels.
How far it goes
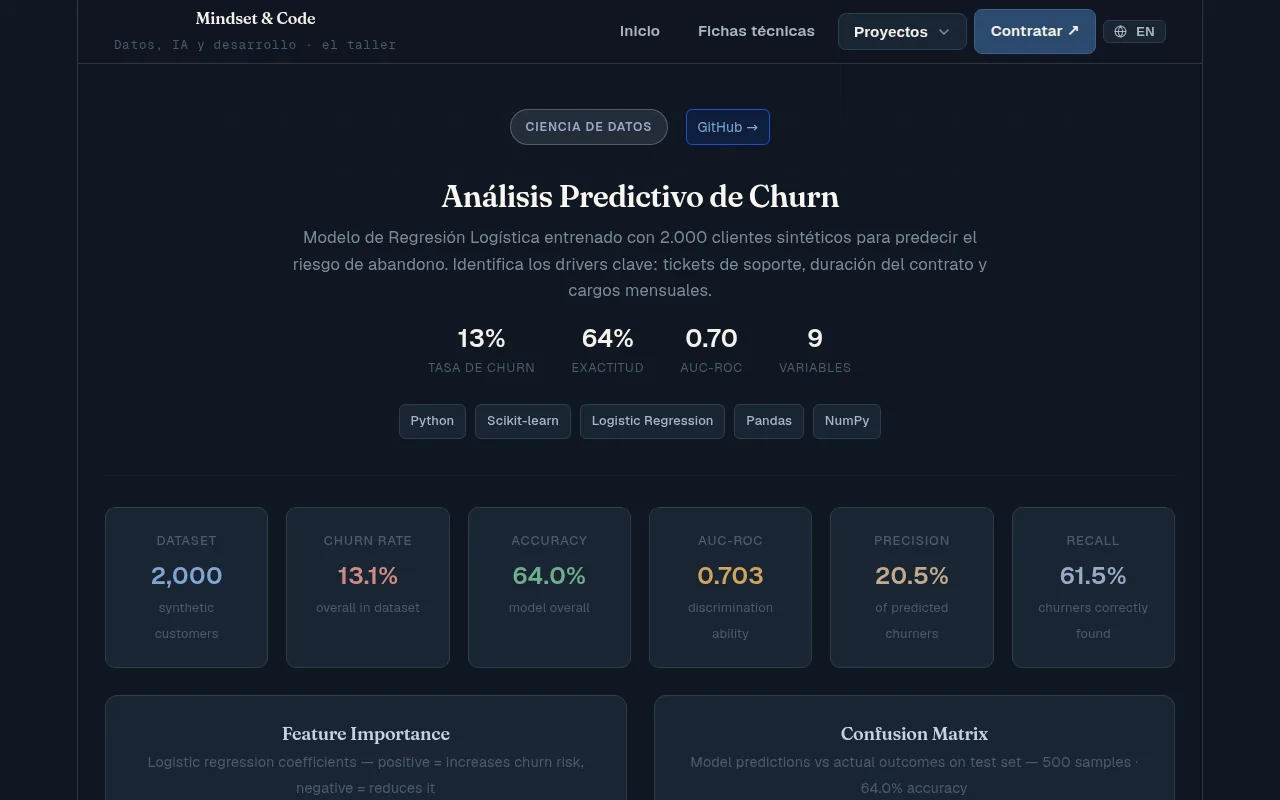
- An AUC of 0.703 measures ranking, not accuracy: given one customer who left and one who stayed, the model puts the leaver first 70 % of the time. Real precision is 0.205, and predicting «nobody leaves» would score 87 % while being useless.
- There is a single train-test split and no cross-validation. The published figures are one realisation, not an average with its interval: a recall of 0.615 is forty hits out of sixty-five.
- The variables are associations, not causes. The generator builds the churn probability as a sum of known indicators; the model recovers it imperfectly. More support tickets going with more churn does not license the conclusion that cutting tickets retains anyone.
- There is no probability calibration and no cost-based threshold selection. Using this for real would mean pricing the call and the lost customer, and that calculation is not here.
- 0,703 AUC-ROC
- 64,0 % accuracy
- 61,5 % of churners, detected
Built with
- Python
- scikit-learn
- React
Where the data comes from
Synthetic data generated by the repository itself: no client information involved.