Sales and weather ETL
Does the weather move sales? The answer lives in the join between two sources nobody designed to be combined.
Data and BI · Python · Browsable demo
The problem
The number that decides something is rarely in one table: it is in the join. And joining two foreign sources properly — each with its own formats, cities and calendars — is half of the real data-engineering work, the half the final chart never shows.
What it does
- Extracts two independent public datasets: retail sales transactions and daily temperatures for major cities.
- Normalises and joins them by city and date, which is exactly where this kind of join breaks.
- Modular extract, transform and load architecture, with logging and traceability at every step.
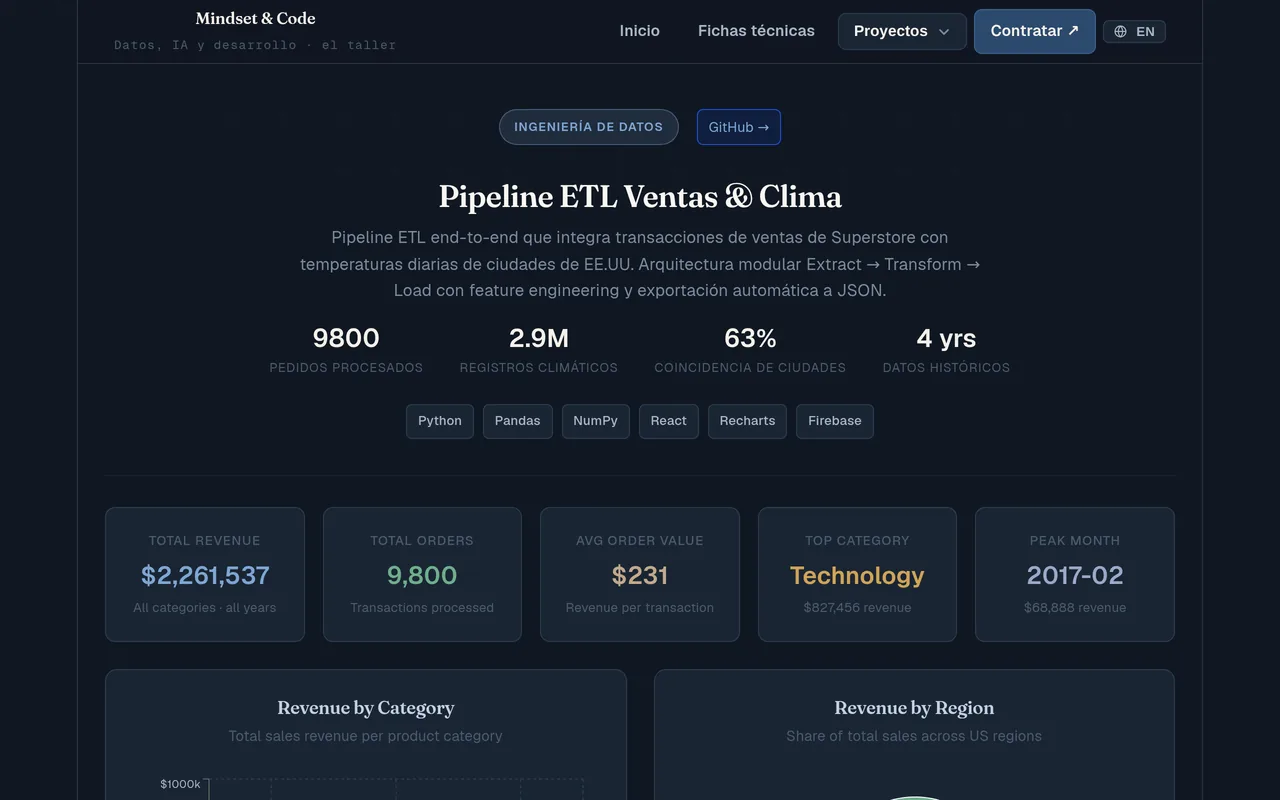
- Leaves six pre-aggregated datasets ready for the dashboard, with no backend to maintain.
What was decided while building it
- The weather side is deduplicated before joining
- Two weather stations in the same city on the same day do not make the join fail: they duplicate every sale in that city and revenue comes out doubled without a single warning. The weather side is aggregated to city-day before it touches sales, and two tests check that total revenue does not change across the join.
- The join key is normalised on both sides
- City and date, with the city name brought to the same shape on both tables. That is exactly where this kind of join breaks: it does not fail, it just stops matching half the rows and the chart comes out just as pretty over a fraction of the business.
- The source sentinel is cleaned at extraction
- The source weather dataset marks missing readings with a negative ninety-nine, which is a perfectly valid number for an arithmetic mean. It is dropped at extraction, not at analysis: an impossible value that reaches the chart has already contaminated everything on the way.
- It works on copies
- The auxiliary join column used to be written onto the caller's own tables: it survived the call and ended up travelling all the way to the final file. Every step now copies what it receives, which is what makes it safe to chain transformations without one dirtying the next.
How far it goes
- The source data is two public Kaggle datasets and is not versioned here. What is published is the process and its forty-one tests; reproducing the volumes means downloading them.
- The project does not measure correlation between weather and sales: it groups average sales by temperature band. Comparing those bands mixes temperature with season, with geography and with the retail calendar. It must not be read as cause.
- The match rate is logged but no minimum is enforced. Sales with no weather reading are excluded from the aggregate, so a poor match would yield an equally convincing chart over less of the business.
- The scatter plot is a five-hundred-point sample, not the full cloud.
- 2 public datasets joined
- 41 tests over the join
- 6 pre-aggregated datasets
Built with
- Python
- Pandas
- Firebase
Where the data comes from
Two public Kaggle datasets: Superstore Sales and Daily Temperature of Major Cities.